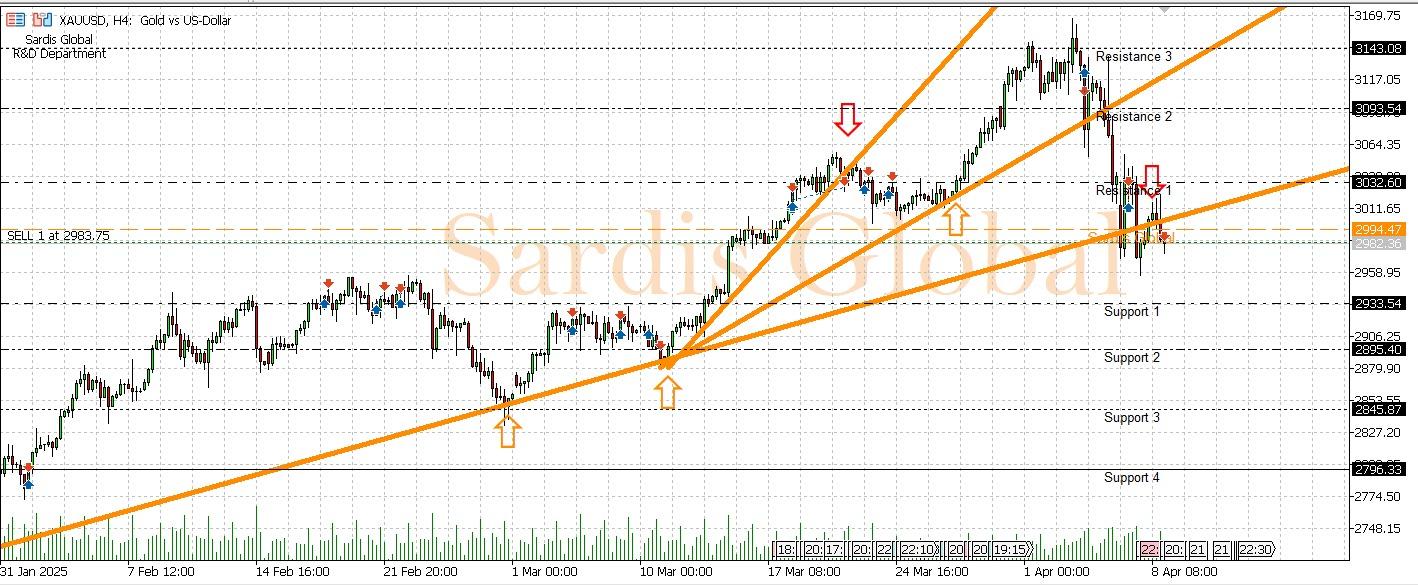
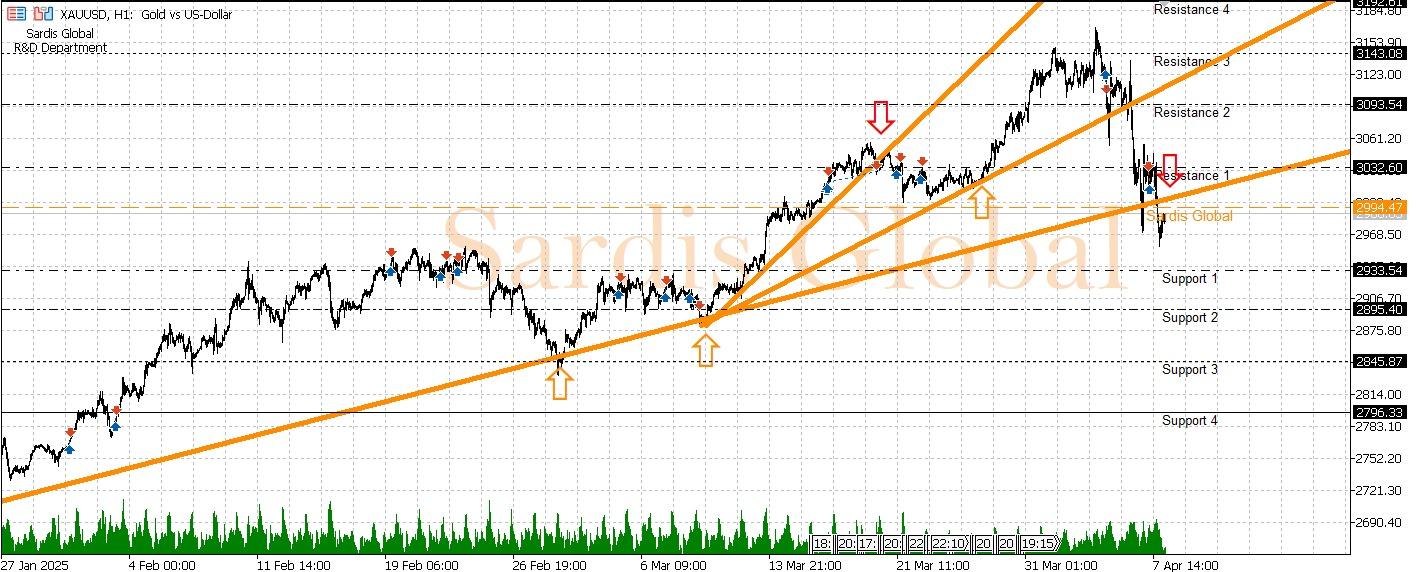
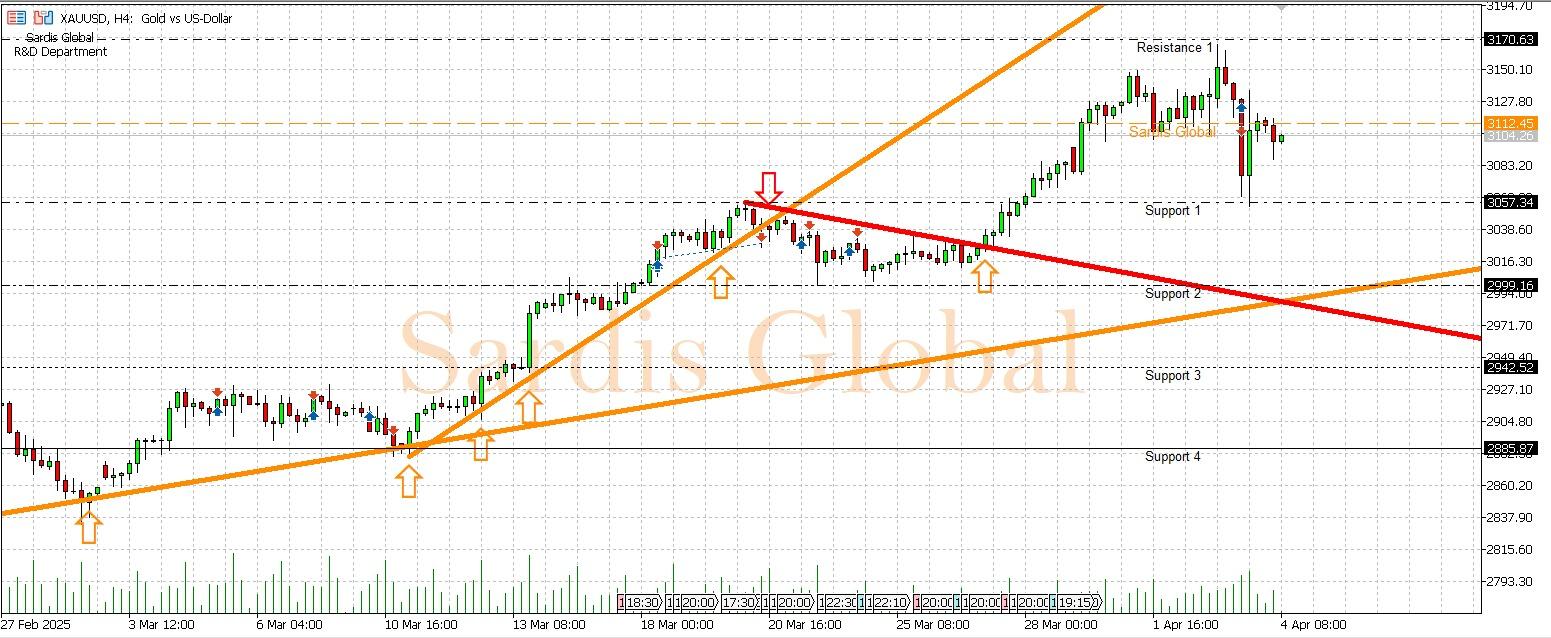
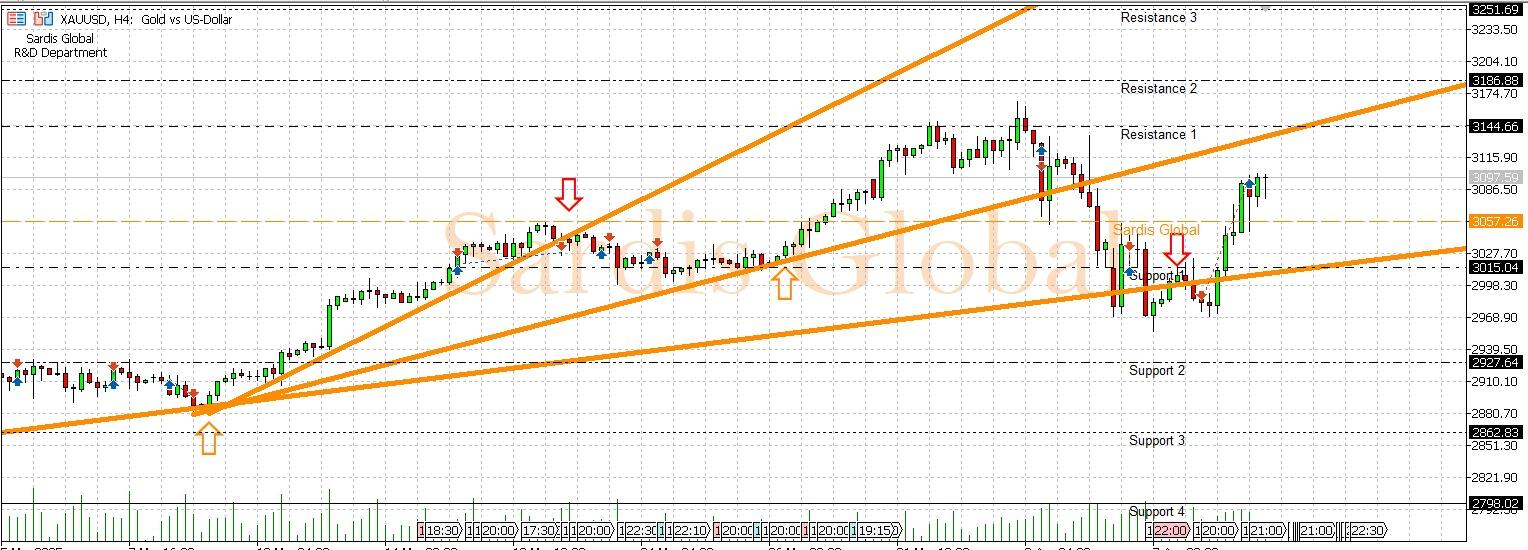
Technical Analysis

NASDAQ

Daily Newsletter

Nasdaq is trading on the positive side. It is possible that the body gaps formed in the daily time frame will be filled. For this reason, we can see the cont...

Read More
image
04 Apr 2025 04:02

DAX

Daily Newsletter

On the DAX side, the horizontal target marked on our chart was 15520. The price continues to rise at this level without stopping. They can also show the level...

Read More
image
04 Apr 2025 04:02

Bitcoin

Daily Newsletter

Bitcoin side, we witnessed sharp declines after our warnings. The price recognized the 4-hour imbalance box defined by the lower limit of 21980. Again, if i...

Read More
image
04 Apr 2025 04:02

NGAS

Daily Newsletter

Natural Gas closed last week at very high levels but started the day with a deep loss at the opening. This move, which took place after the 2.82 and 2.95 lev...

Read More
image
04 Apr 2025 04:02

EURUSD

Daily Newsletter

EURUSD pair targeted the liquidities we mentioned yesterday. Open imbalance and peak liquidity reached. The price seems to have slowed down at the EMA200 lev...

Read More
image
04 Apr 2025 04:02

GBPUSD

Daily Newsletter

GBPUSD The regions that are considered as important support in the daily period have not been lost yet. continues to be traded above 1.2015. may target the o...

Read More
image
04 Apr 2025 04:02

USDJPY

Daily Newsletter

If we look at the 4-Hour chart of the USDJPY pair, we will notice that the upward momentum is almost exhausted. Although the daily averages have not been brok...

Read More
image
04 Apr 2025 04:02

USDTRY

Daily Newsletter

If we look at the Dollar/Turkish Lira parity in the weekly time frame, we will notice the continuation of the determined upward trend. EMA10 (in purple) is an ef...

Read More
image
04 Apr 2025 04:02

XAUUSD

Daily Newsletter

Ounce gold fell to the intersection of EMA20 and EMA100 in the 4-hour view. The price received a decisive reaction from here. The green average should be pro...

Read More
image
04 Apr 2025 04:02

DAX

Daily Newsletter

DAX side EMA50 on 4-hour charts is now lost. If there is a movement below 12225, caution should be exercised. This is the movement that could trigger further ...

Read More
image
04 Apr 2025 04:02

WTI

Daily Newsletter

WTI Crude Oil tested the expected level around 78.80. It made a very rapid rise in a short time. This impulsive move could take the price to the $82 region. ...

Read More
image
04 Apr 2025 04:02

Bitcoin

Daily Newsletter

Bitcoin side experienced a 21500 drop. At this level, the price also met with the EMA200 and SMA200 averages. If the area is lost, the decline will continue. ...

Read More
image
04 Apr 2025 04:02

BRENT

Daily Newsletter

BRENT We can see the continuation of the accelerated movement in Petro. 87.20 – 88.00 region seems to be a potential target. As long as the price remains abo...

Read More
image
04 Apr 2025 04:02

NGAS

Daily Newsletter

NATGAS side 2.44 still has not been lost. However, this area is being tested for the third time in a short time. If the level is lost, the 2.18 area will be t...

Read More
image
04 Apr 2025 04:02

NASDAQ

Daily Newsletter

On the Nasdaq side, our expectation of an increase to the 12420-12480 region was realized. The price quickly turned down from this region. However, the dire...

Read More
image
04 Apr 2025 04:02

DAX

Daily Newsletter

DAX side reached 15656 liquidity. There is another peak liquidity not far from here. It is around 15730. The price may test this level as it is this close. T...

Read More
image
04 Apr 2025 04:02

Bitcoin

Daily Newsletter

Bitcoin side, we witnessed sharp declines after our warnings. Price recognized the 4-Hour imbalance box defined by the lower limit of 21980. Again, if it se...

Read More
image
04 Apr 2025 04:02

NGAS

Daily Newsletter

Natural gas lost the 2.60 level as a result of sharp declines. 4 The price fell below the moving average supports in the hourly view. The market structure wa...

Read More
image
04 Apr 2025 04:02

EURUSD

Daily Newsletter

EURUSD The blue horizontal level indicated on the chart is where the 200-day exponential average support passes. 4 It is clearer how effective this region i...

Read More
image
04 Apr 2025 04:02

EURUSD

Daily Newsletter

EURUSD moved up from the demand zone around 1.065, but failed to settle above 1.082. Price is still trading below the moving averages. A possible decline to a...

Read More
image
04 Apr 2025 04:02

GBPUSD

Daily Newsletter

GBPUSD lost its important support in the daily time frame. The 200-day simple average was broken with Powell's statements. 1.1837 is expected to continue to ...

Read More